GALIOT AI in action!
Clustering and Pattern Recognition of Aviation Safety Reports
INTRODUCTION
Identifying and managing safety trends inside the organization and within the interfaces with external service providers is one of the key processes of a proactive safety approach.
The safety reporting system mandatory required by ICAO Safety Management System (SMS) serves as a primary data source for sensemaking and understanding the organization's current level of safety.
Traditionally incoming safety reports are analyzed and classified manually what is a complex and time-consuming task that requires highly qualified safety experts. The complexity of aviation operations and a growing number of occurrence reports require a novel tool based on machine learning and data science computer algorithms that can help safety practitioners to perform this task more effectively.
This case study demonstrates how the GALIOT AI framework based on Natural Language Processing (NLP) and Machine Learning (ML) techniques can be used for unsupervised clustering, topic modeling, and sensemaking of aviation safety reports.
METHOD
Database and data preprocessing
Aviation Safety Reporting System (ASRS) is a huge database having more than a million aviation safety reports from various service providers. For this case study, only passengers and cargo flight reports from the last several years where aircraft were somehow involved have been analyzed.
A single ASRS report consists of about 90 numerical or classification metadata attributes and two free-form text-based columns for occurrence description and the report title.
For all report attributes GALIOT AI automatically created a corresponding dictionary for a string to binary value representation required for statistical analysis.
Only for the “Event_Output” attribute, an additional manual task by a safety expert was performed to match event severity potential according to ICAO Risk Matrix classification (Catastropich, Hazardous, Major, Minor, Negligible)
Clustering and attribute correlation
Clustering is a type of unsupervised learning method used as a data analysis technique for discovering patterns and dividing entries (here safety reports) into a number of groups based on similarity and dissimilarity between them.
For this case study clustering has been performed using BERT (Bidirectional Encoder Representation from Transformers developed by Google AI) for safety report narrative text representation, UMAP (Uniform Manifold Approximation and Projection) for nonlinear dimensionality reduction, K-means for clustering algorithm, and Silhouette method for interpretation and validation data consistency within the clusters.
The relationships between report metadata attributes are calculated using Pearson’s correlation coefficient.
RESULTS
Results are presented in the question-answer form, where each next question raised is based on the answer to the previous question.
For this demonstration, the drill-down process is performed only for one identified path, but in the real environment, all paths opened are analyzed similarly.
1. How many consistent clusters (report groups) exist in the dataset?
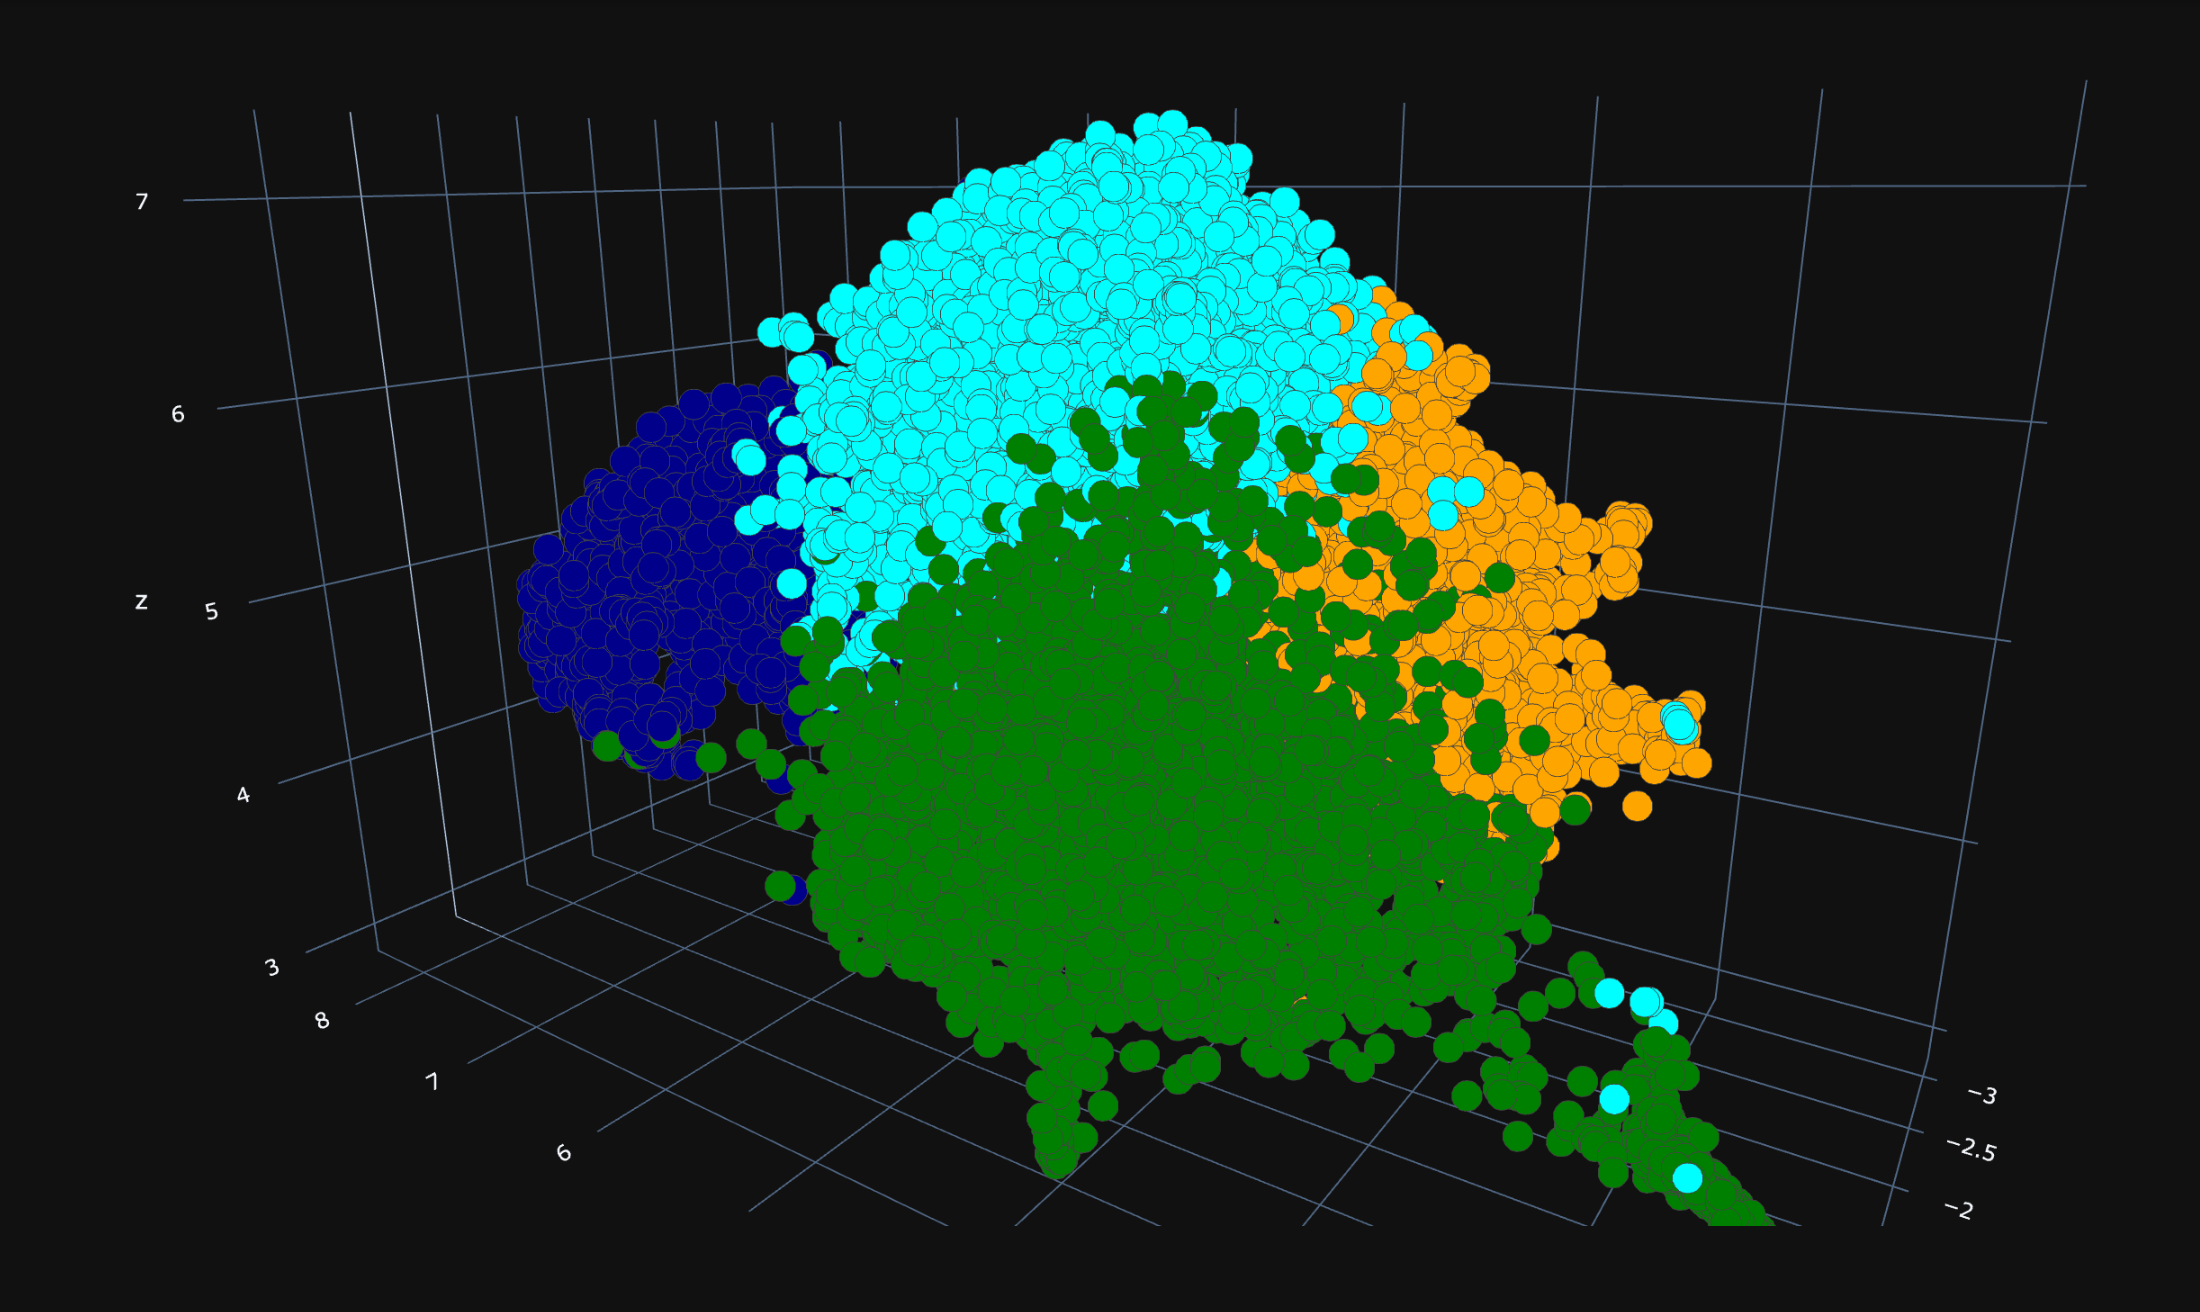
GALIOT AI detected four consistent safety report clusters. The distribution of reports for each cluster is presented in a 3D graph as different colored dots.
2. What is the most critical cluster?
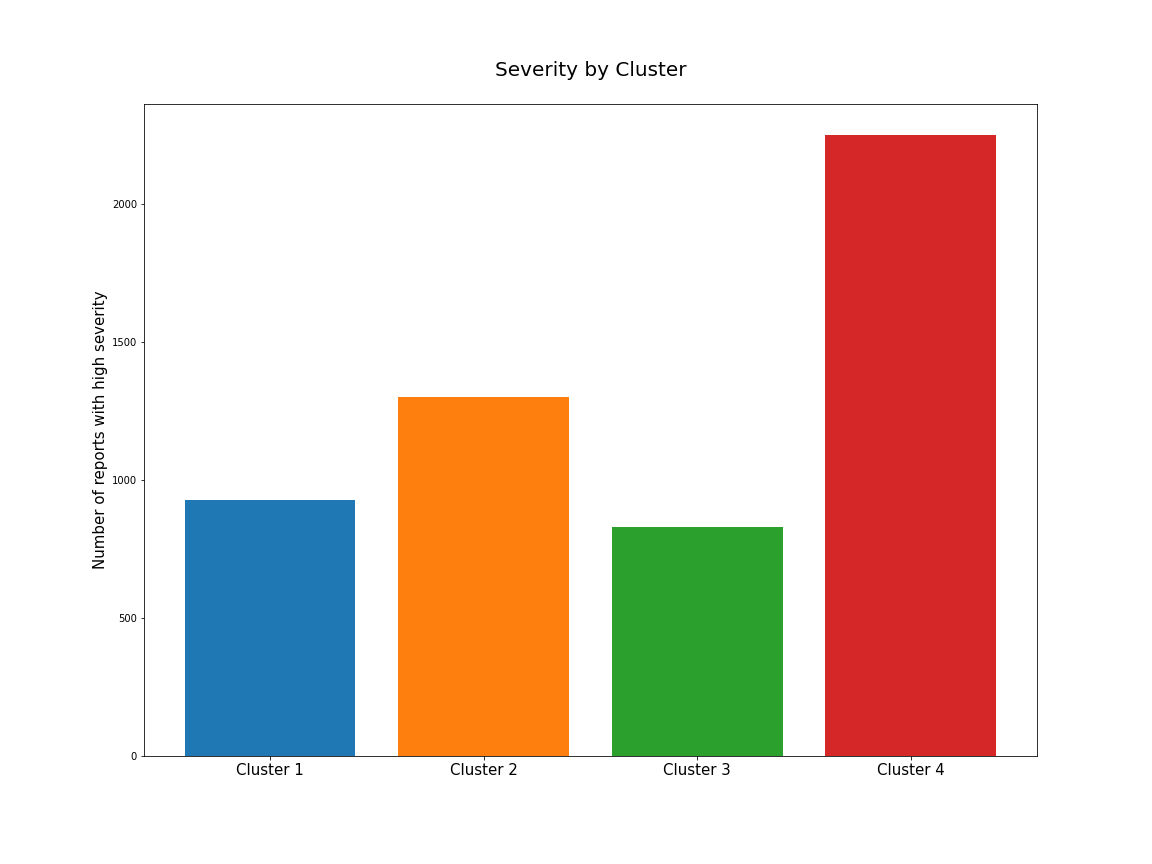
Criticality is calculated by counting the number of cluster reports having either catastrophic or hazardous severity potential.
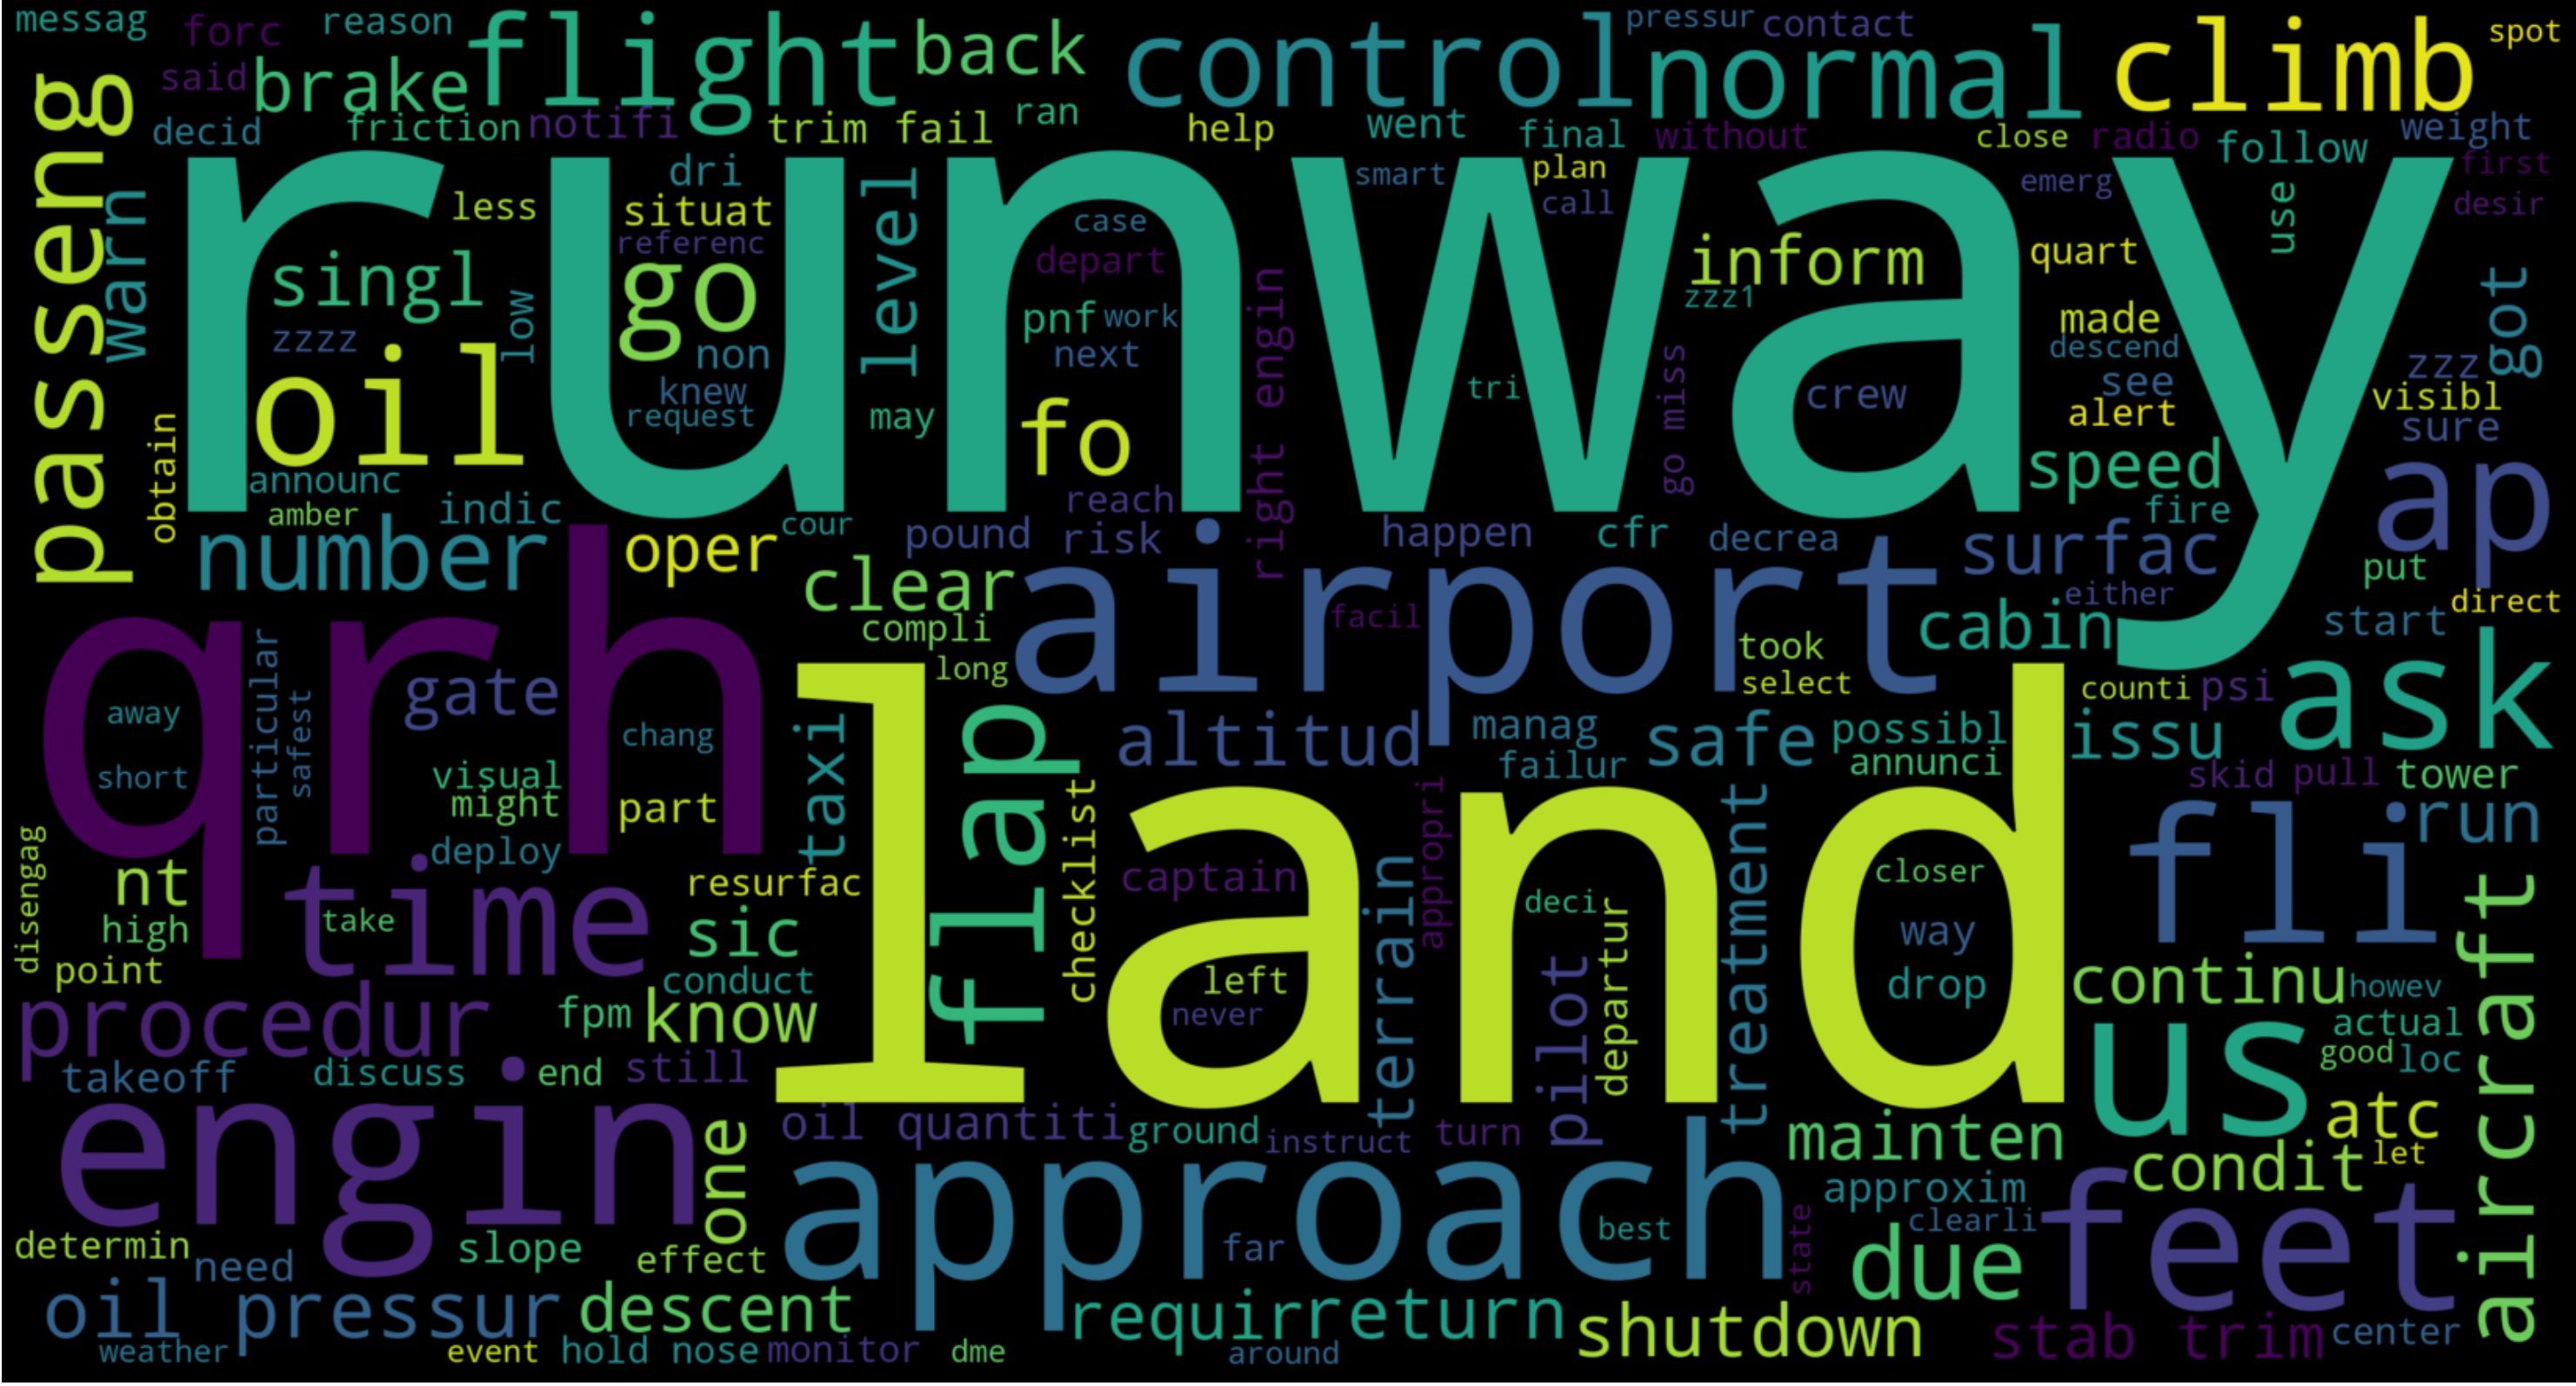
3. What are the Cluster 4 topics?
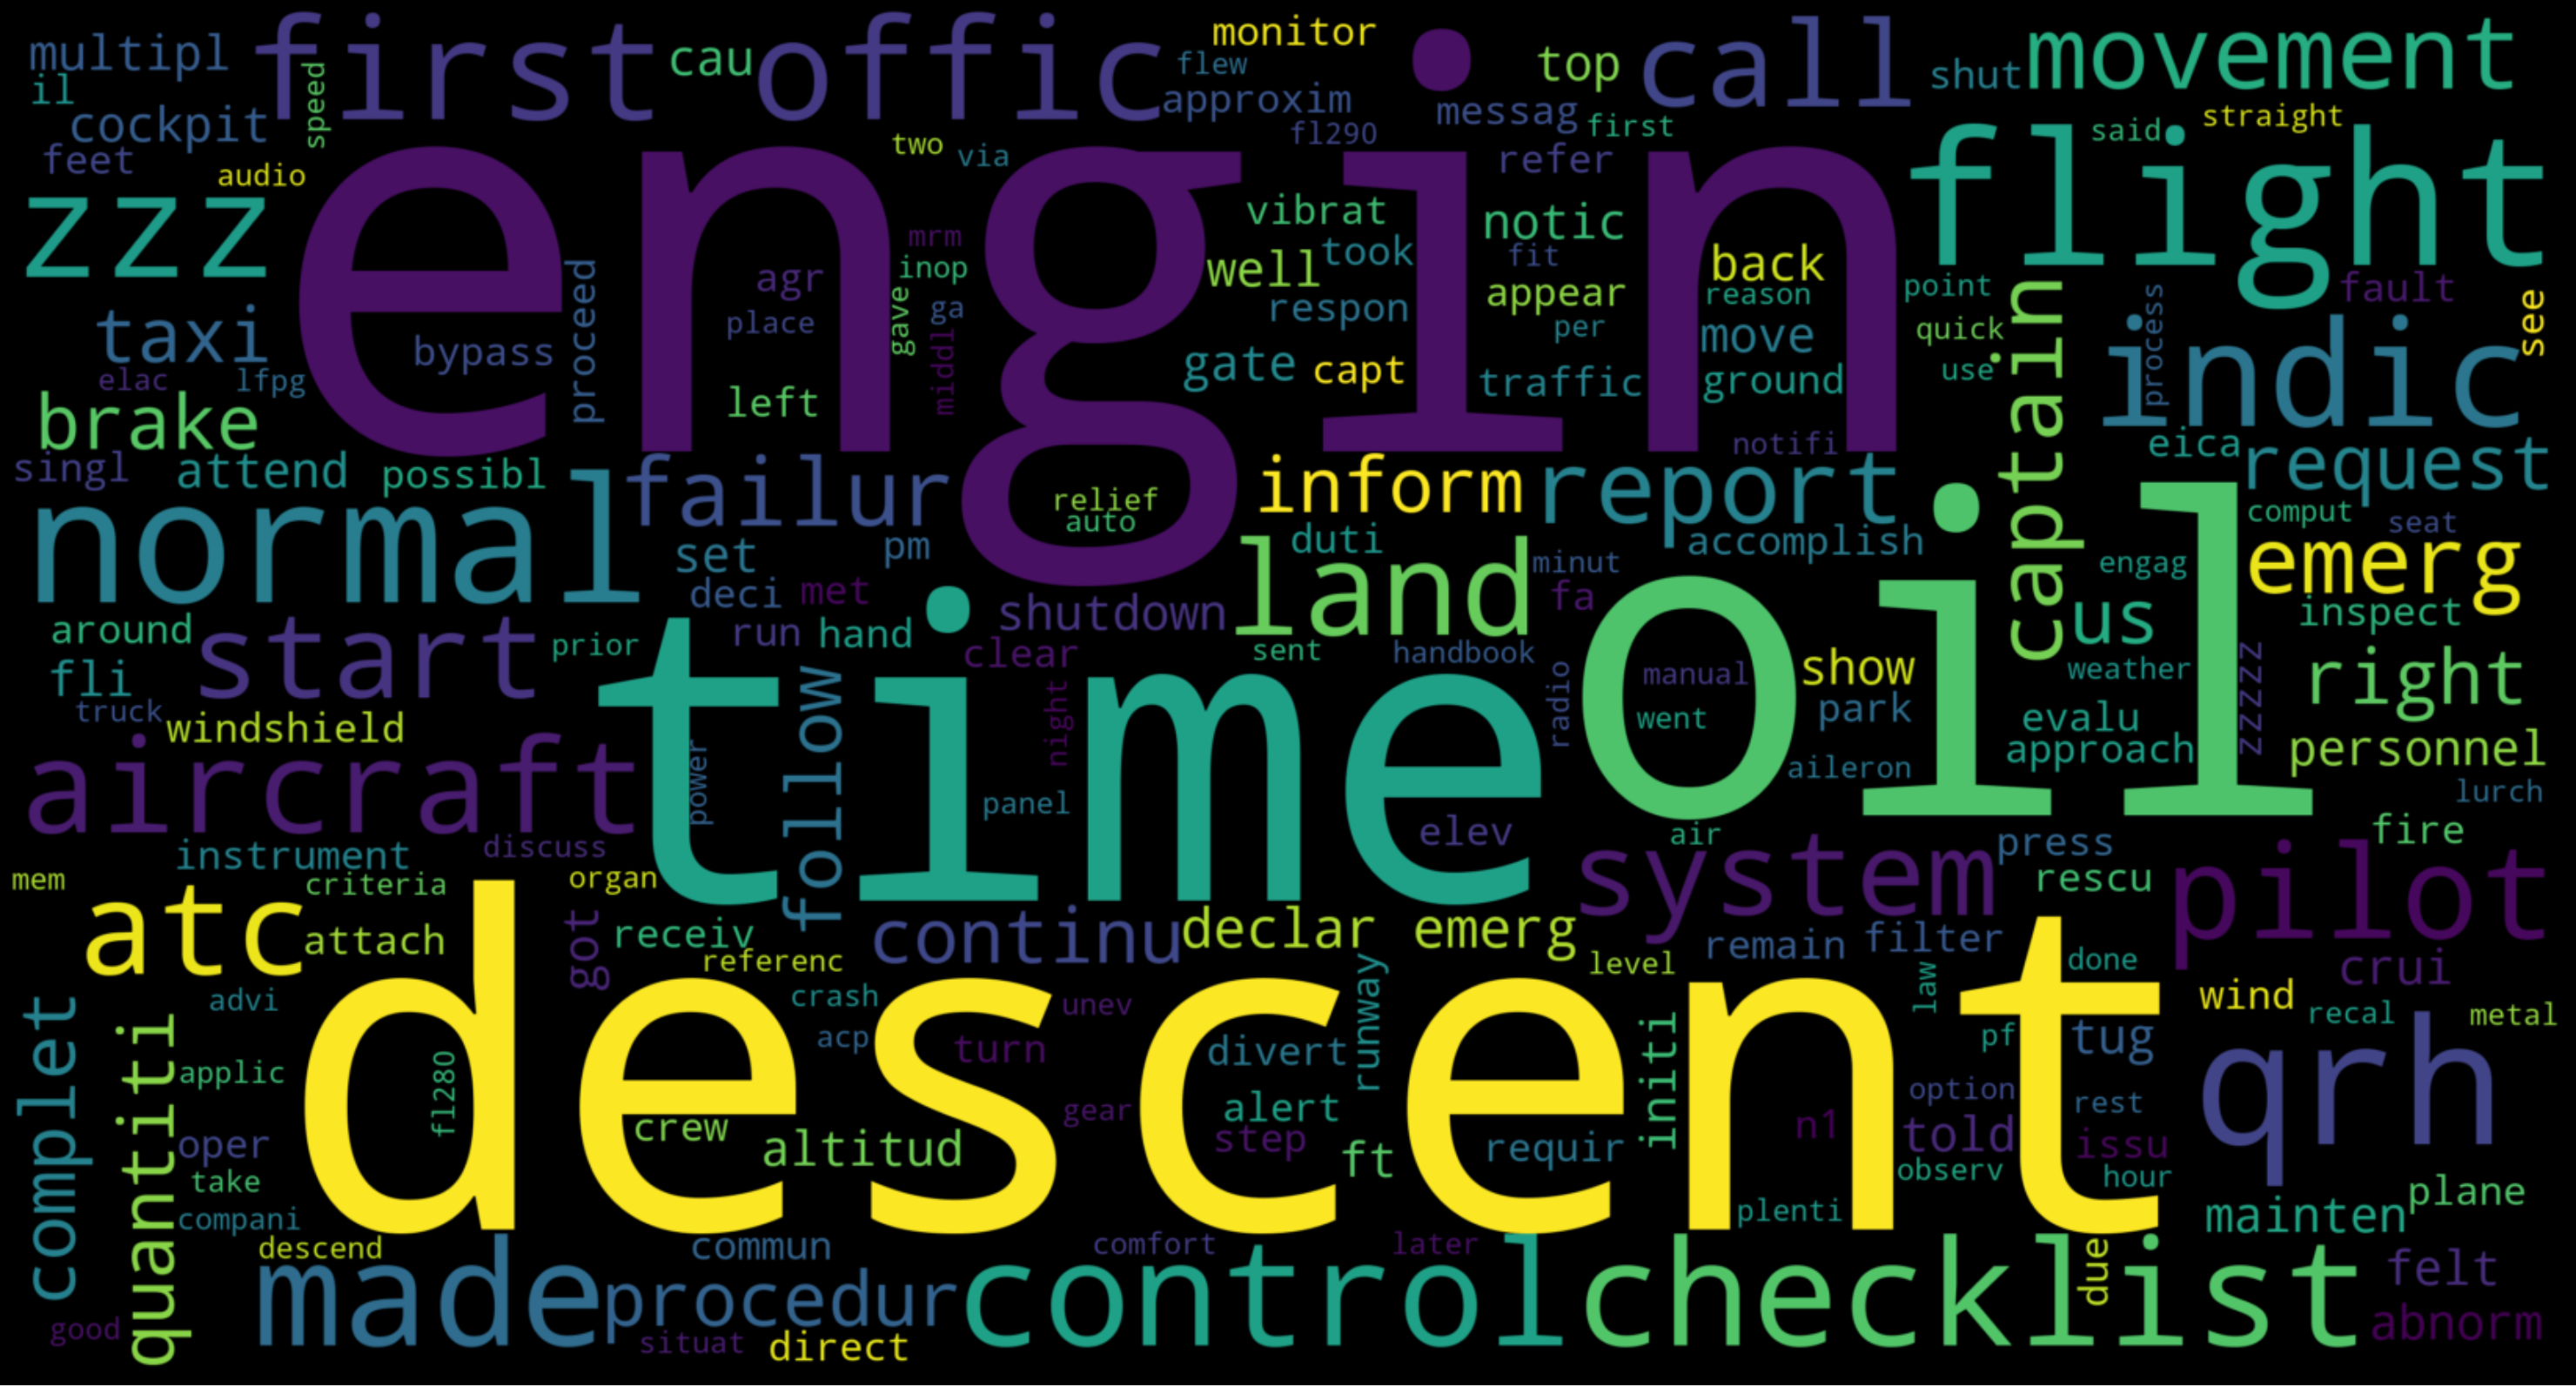
Top identified topics in Cluster 4 are presented as word-cloud created from the most common words used. Cluster 4 is also labeled as “Engine, Desc” according to the two most used words in occurrence description.
4. What is the most critical Anomaly Event in Cluster 4?
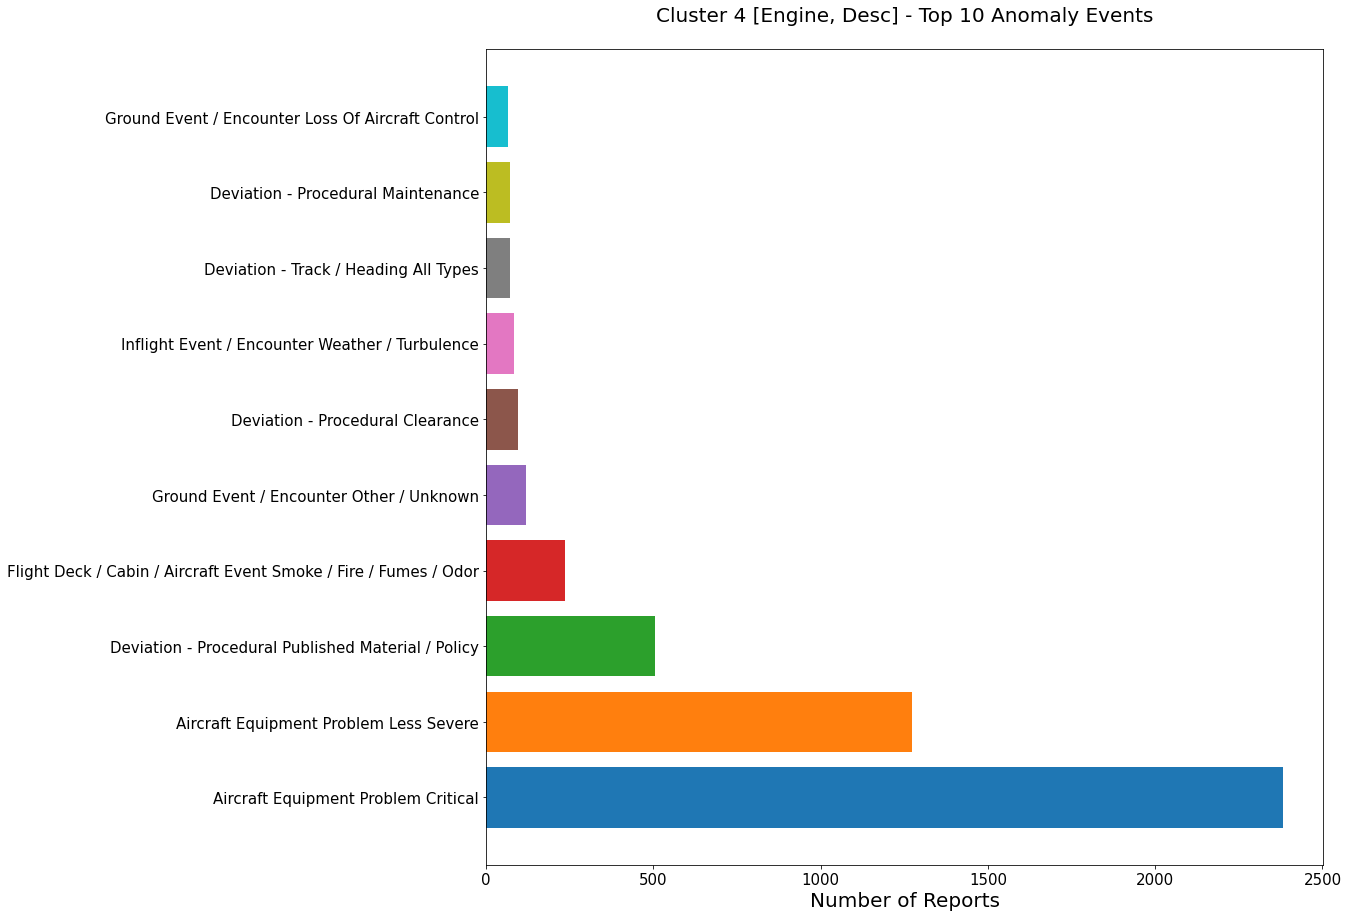
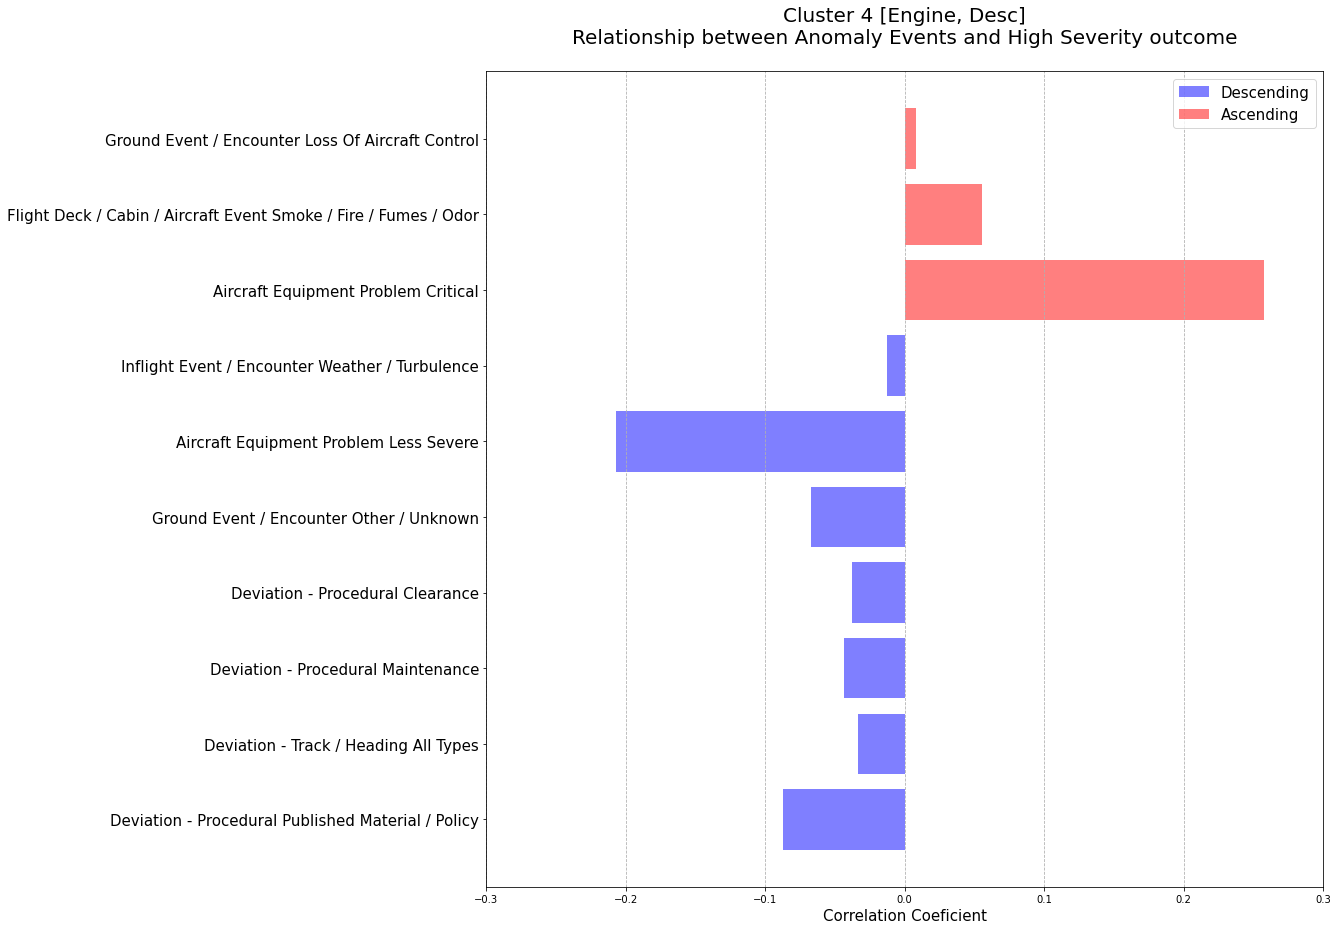
The most critical Anomaly Event is "Aircraft Equipment Problem Critical"!
The criticality is computed in two steps. First, the top ten Anomaly Events are identified, and after that, Pearson’s correlation coefficients between all Anomaly Events and High Severity outcomes are computed.
5. What is the most critical Aircraft Component in Cluster 4?
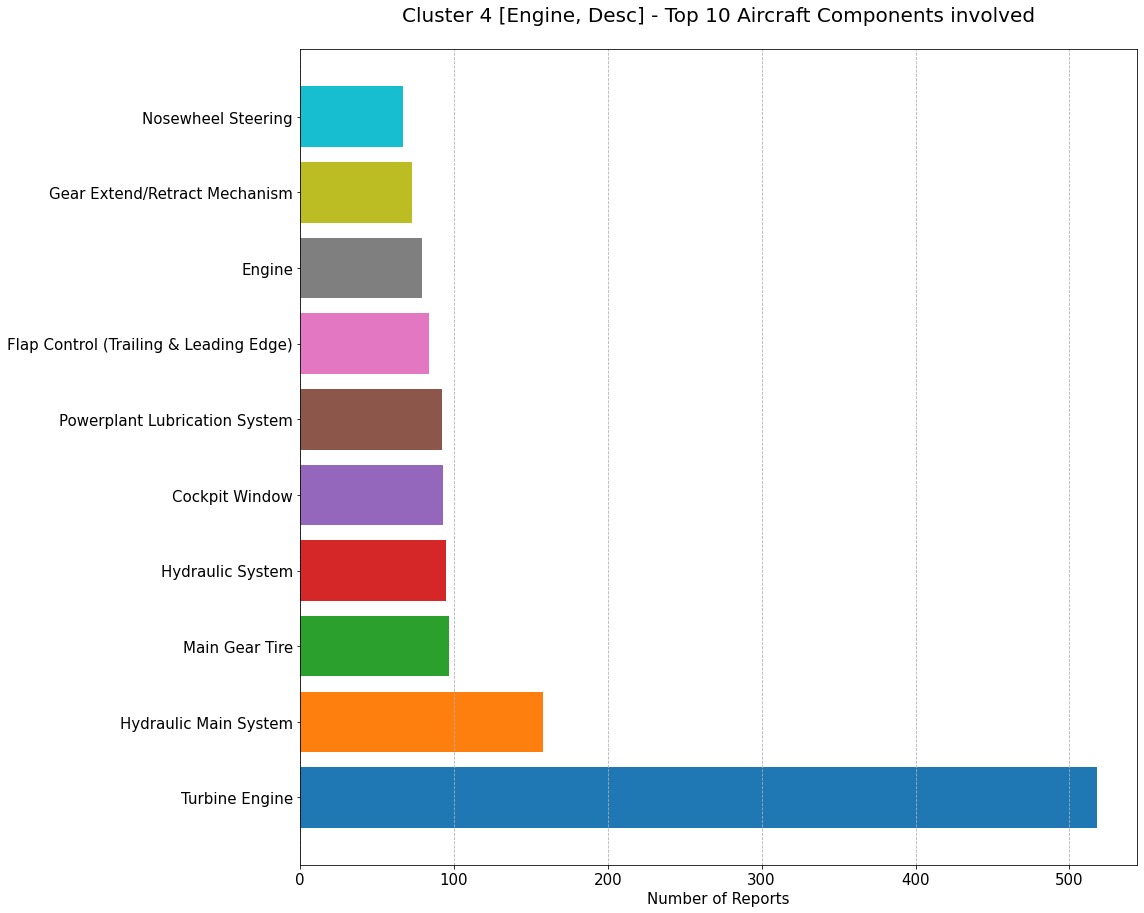
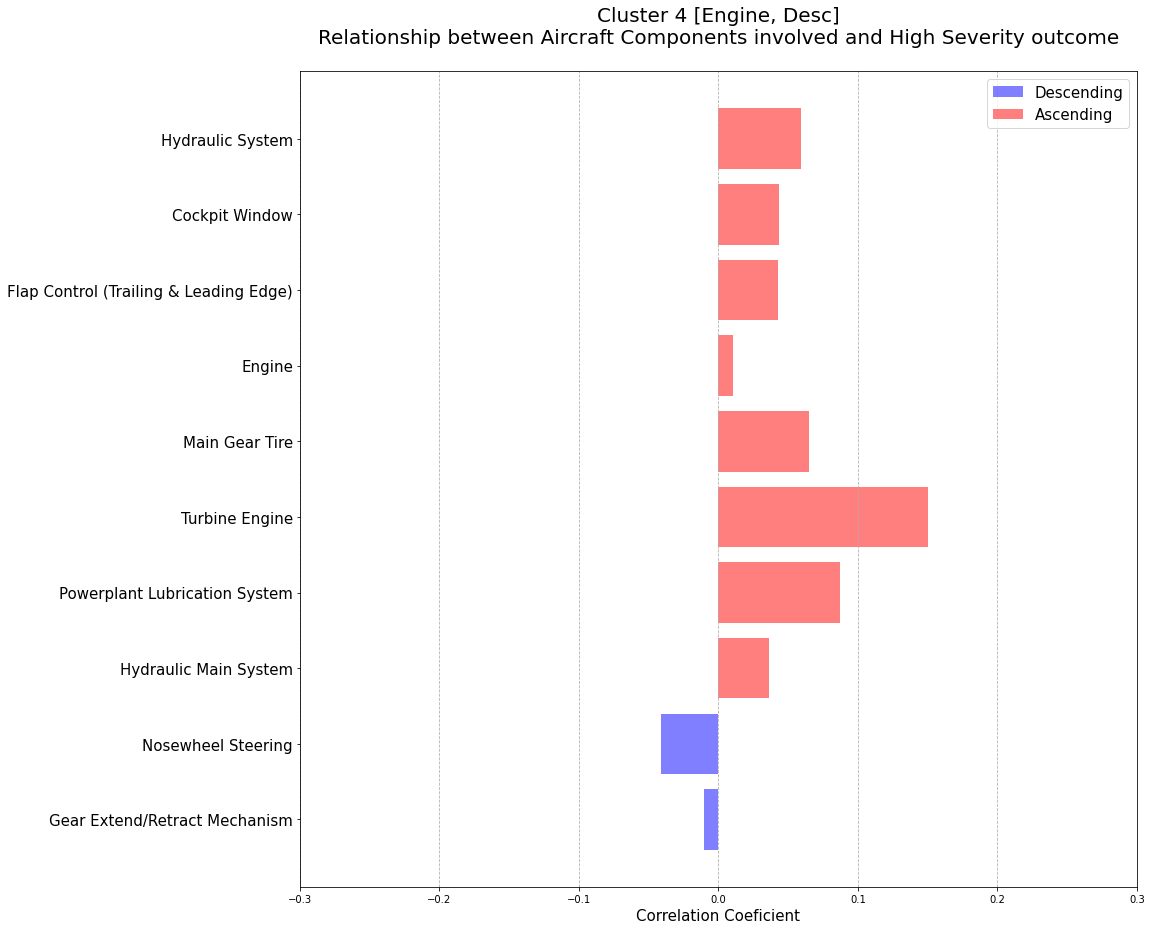
The most critical Aircraft Component is "Turbine Engine"!
The aircraft component criticality is computed in the same manner as for Anomaly Events.
6. What are the Aircraft Models mostly exposed to Turbine Engine issue in Cluster 4?
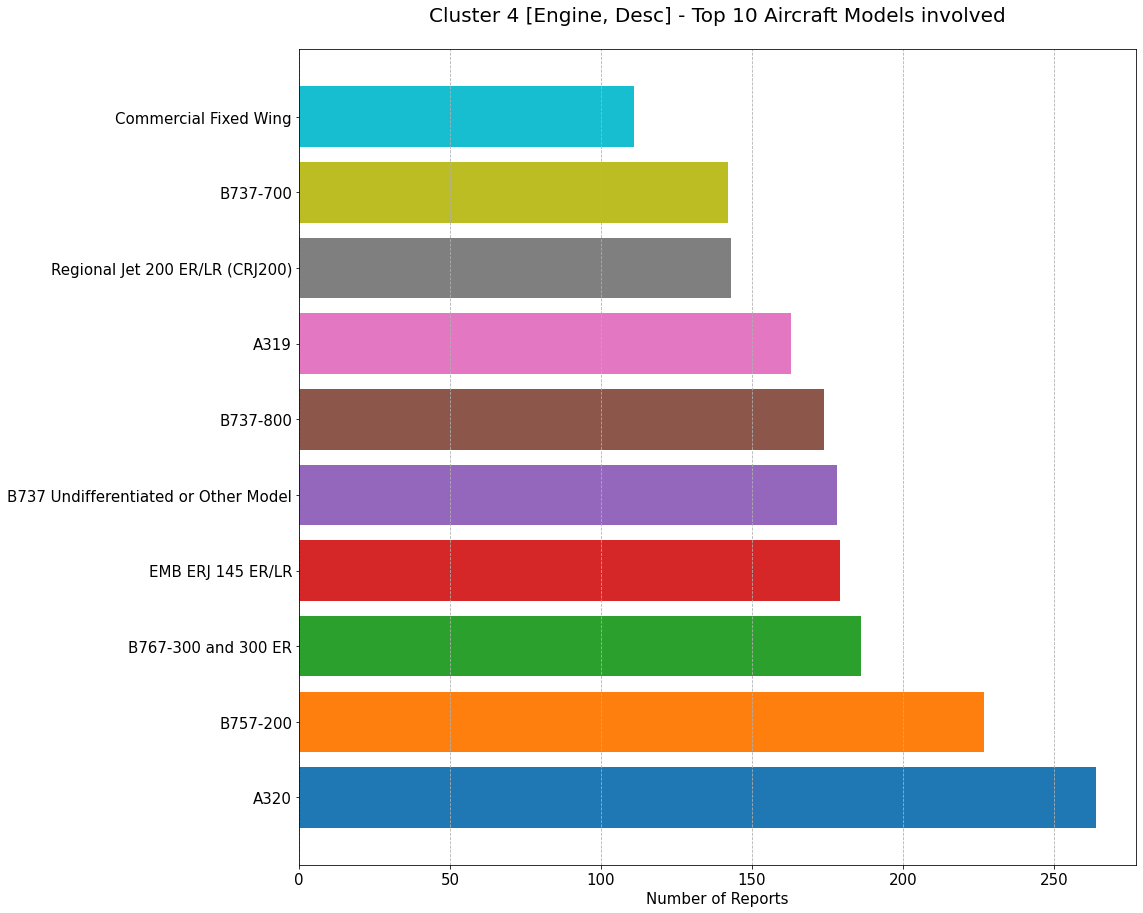
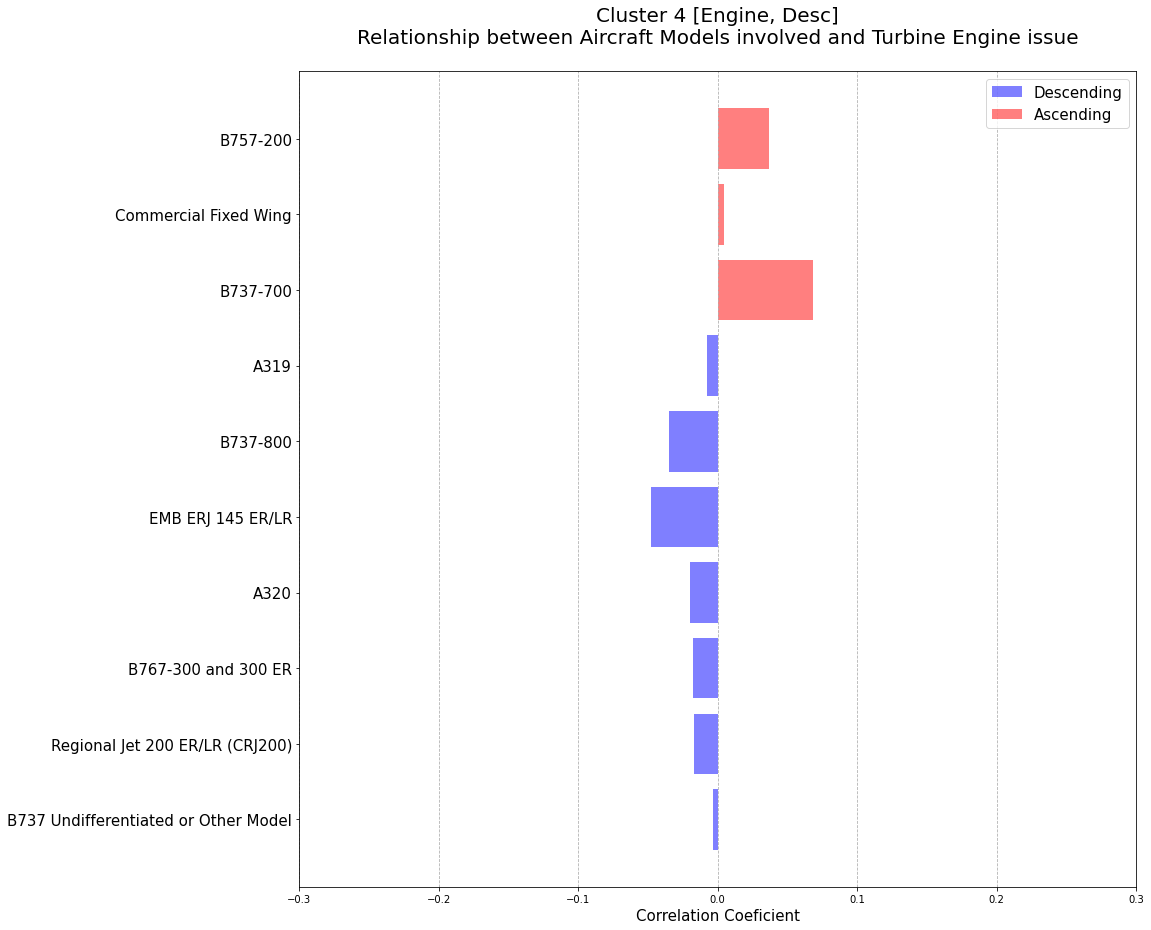
Aircraft models mostly exposed to Turbine Engine issues are B737-700 and B757-200!
Here we can notice the advantages of using Pearson’s correlation coefficient because although model B737-700 is listed very low in the Top 10 graph, this model is more exposed to the Turbine Engine issue than the A320 model.
7. What is the main cause of the Turbine Engine issues in Cluster 4?
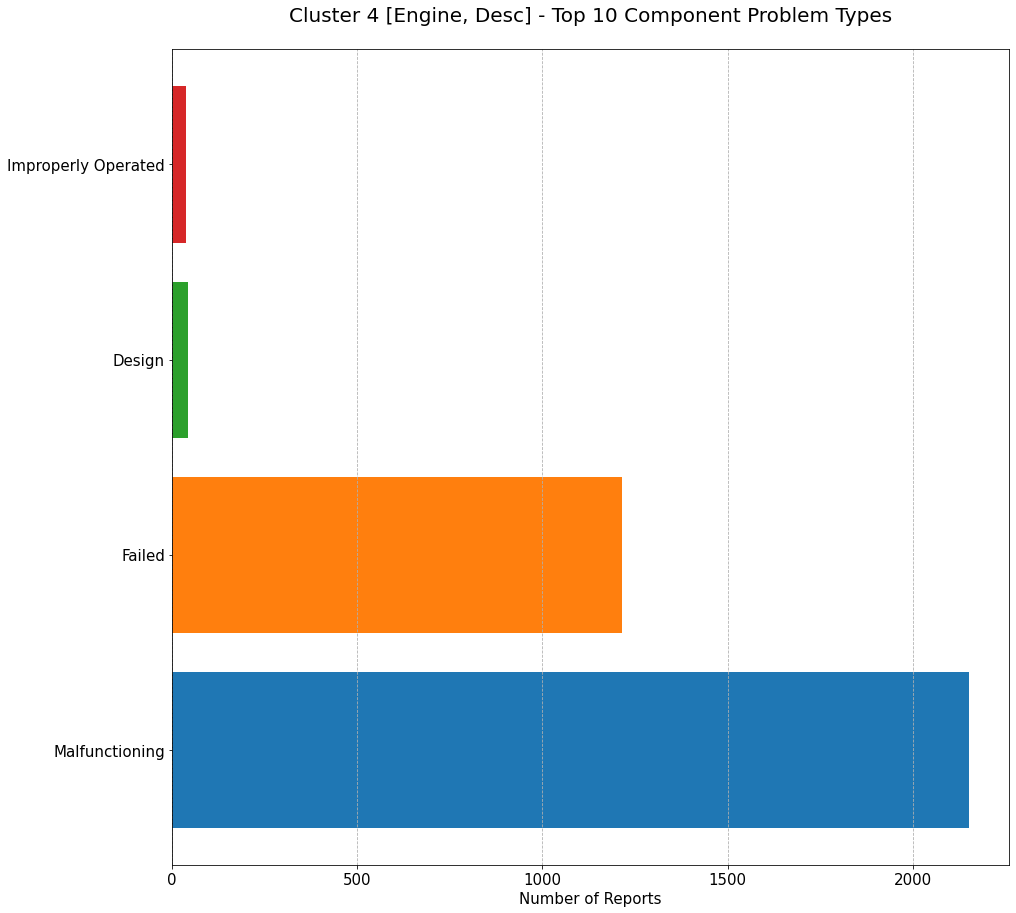
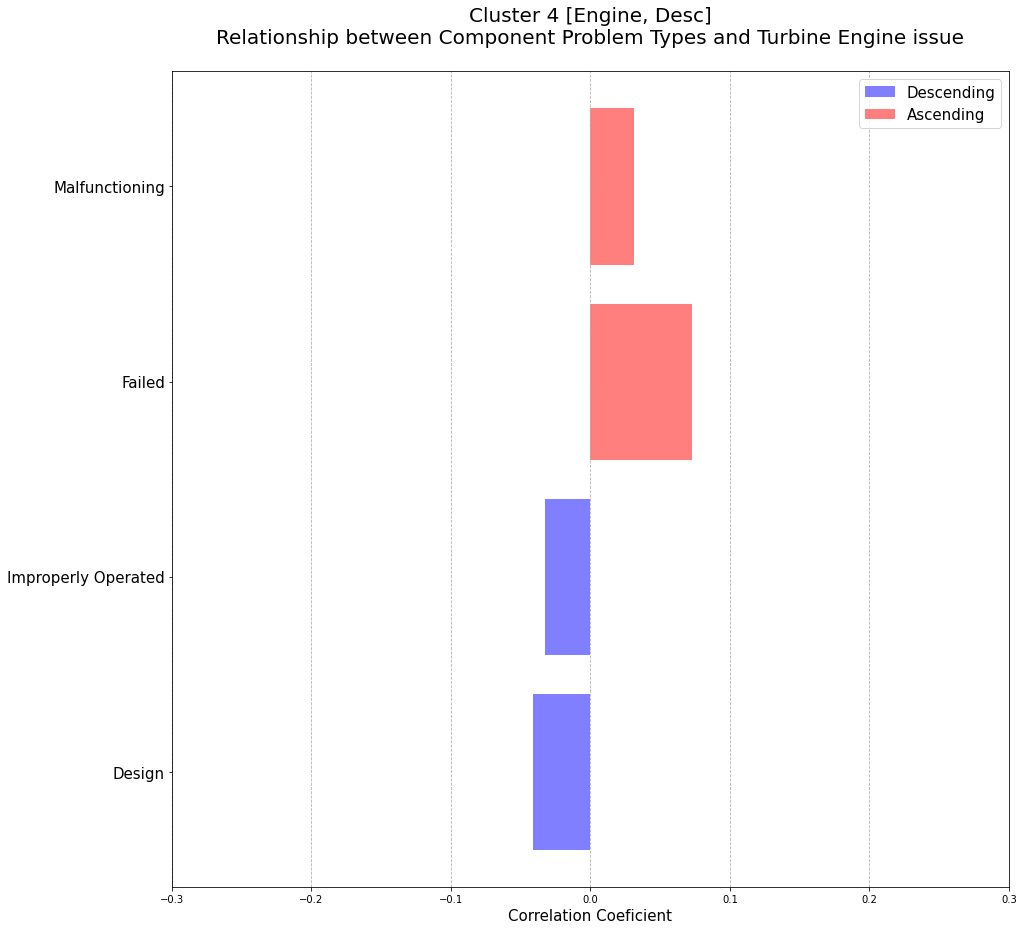
The main cause of the Turbine Engine issues is "Failed"!
The same discussion applies to the cause of the Turbine Engine issue as for Aircraft Models.
8. When (in which phase of flight) is the most Turbine Engine issues detected in Cluster 4?
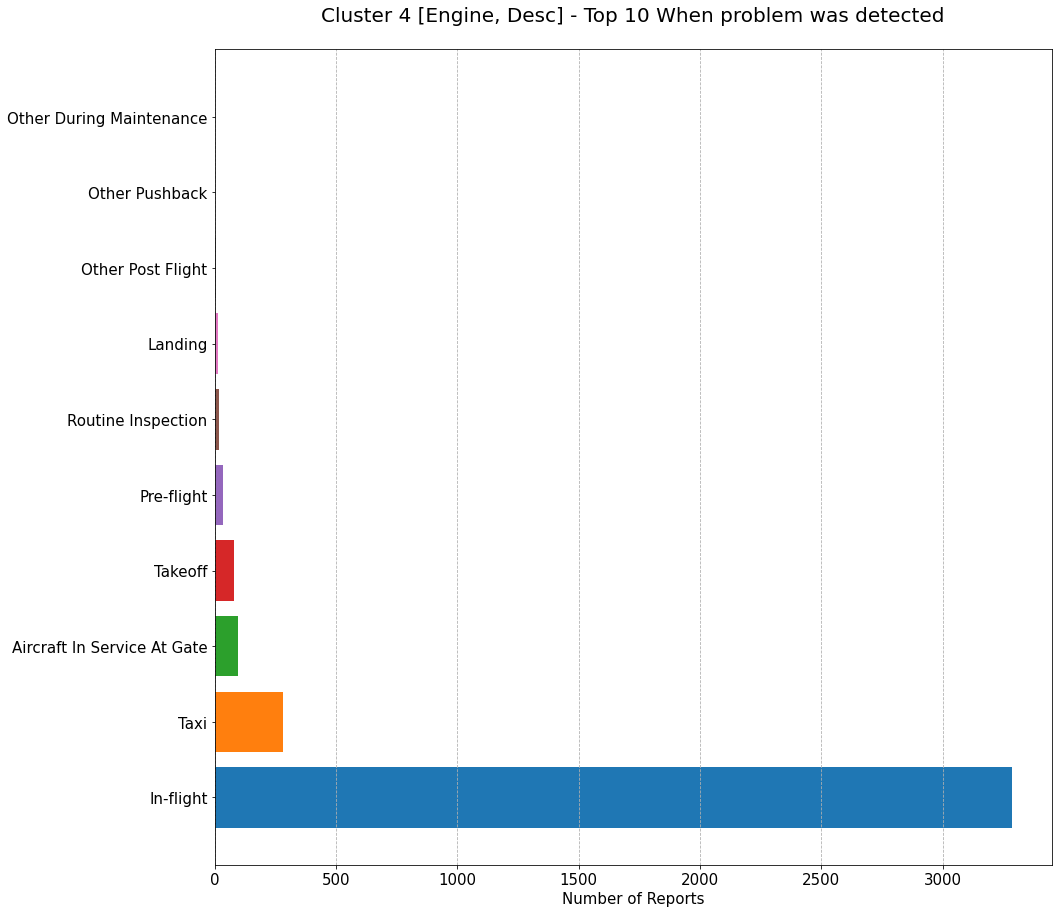
"In-flight" is the phase of flight when the most "Turbine Engine" issues are detected!
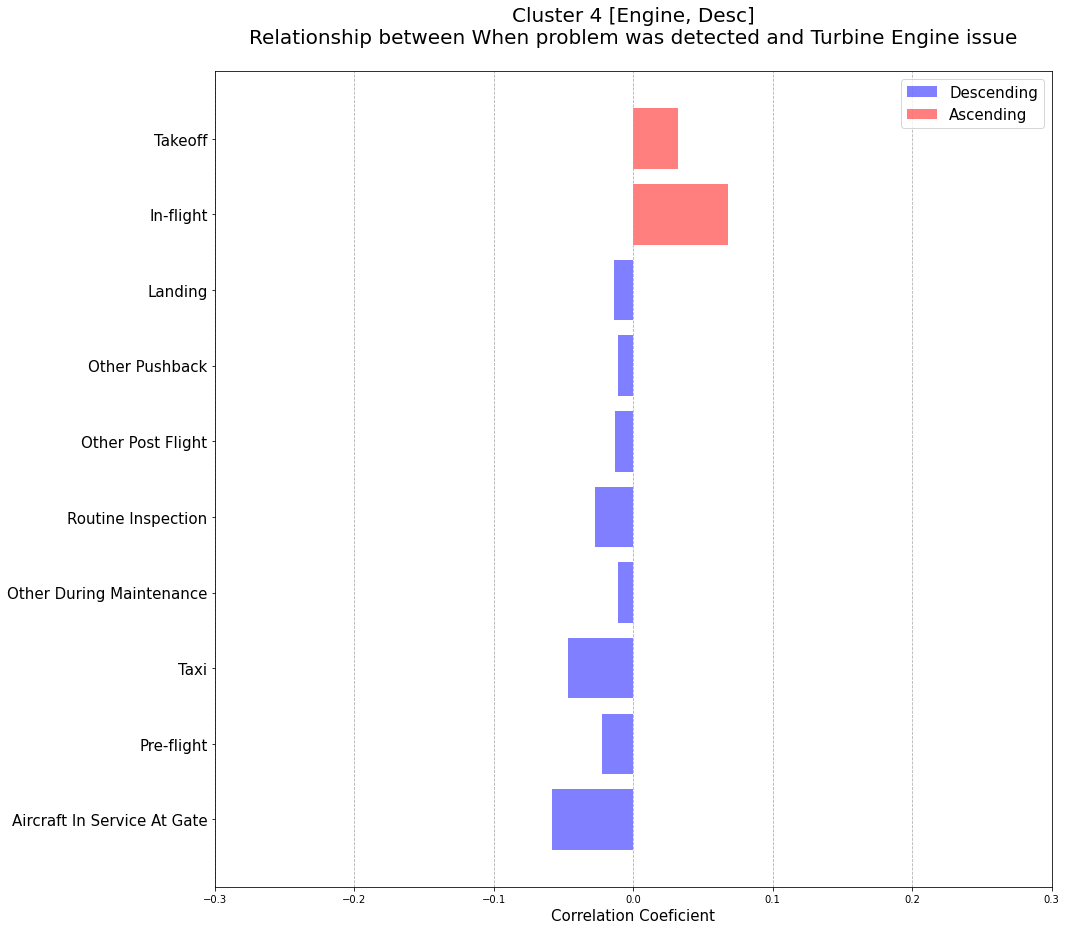
The Correlation Coefficient graph shows that two very critical phases of flight (In-flight and Takeoff) are having the strongest relationship with the Turbine Engine issue.
9. Who/What detected the most Turbine Engine issues in Cluster 4?
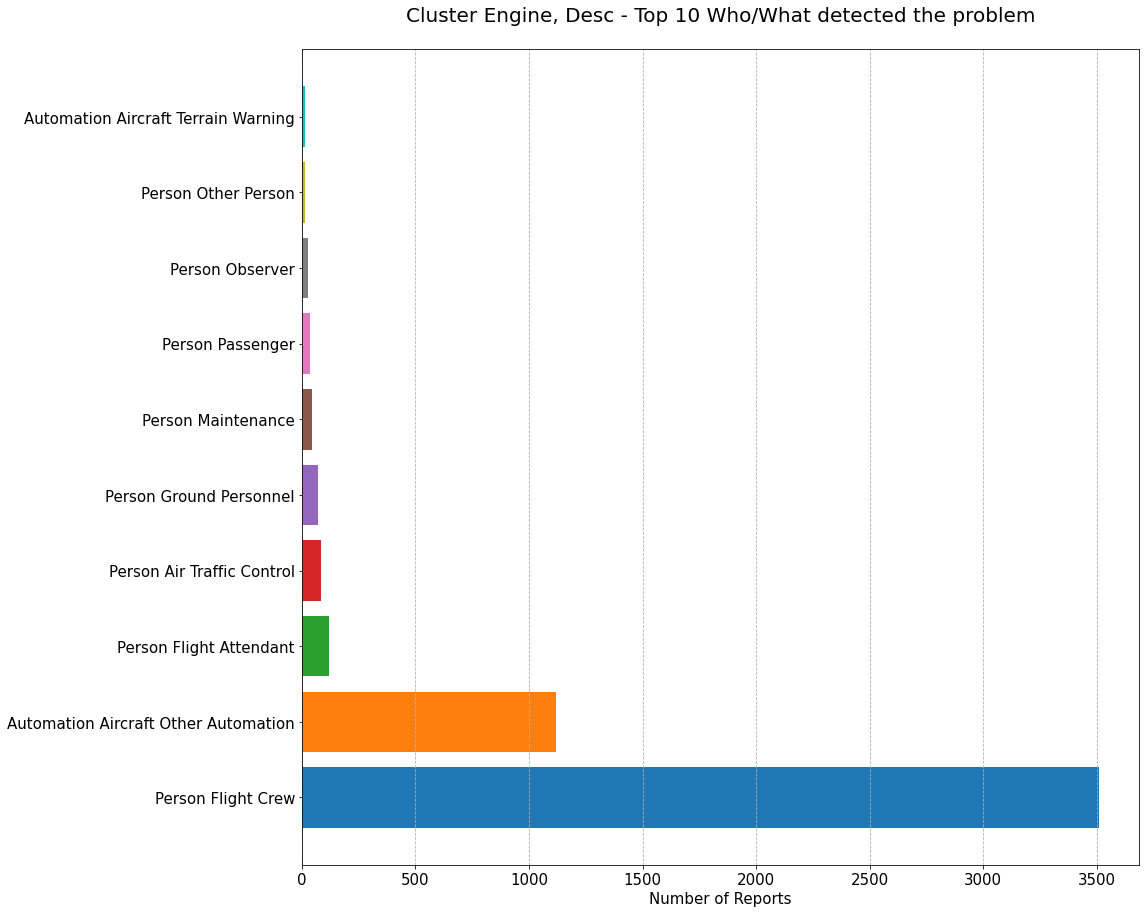
The most Turbine Engine issues are detected by "Person Flight Crew"!
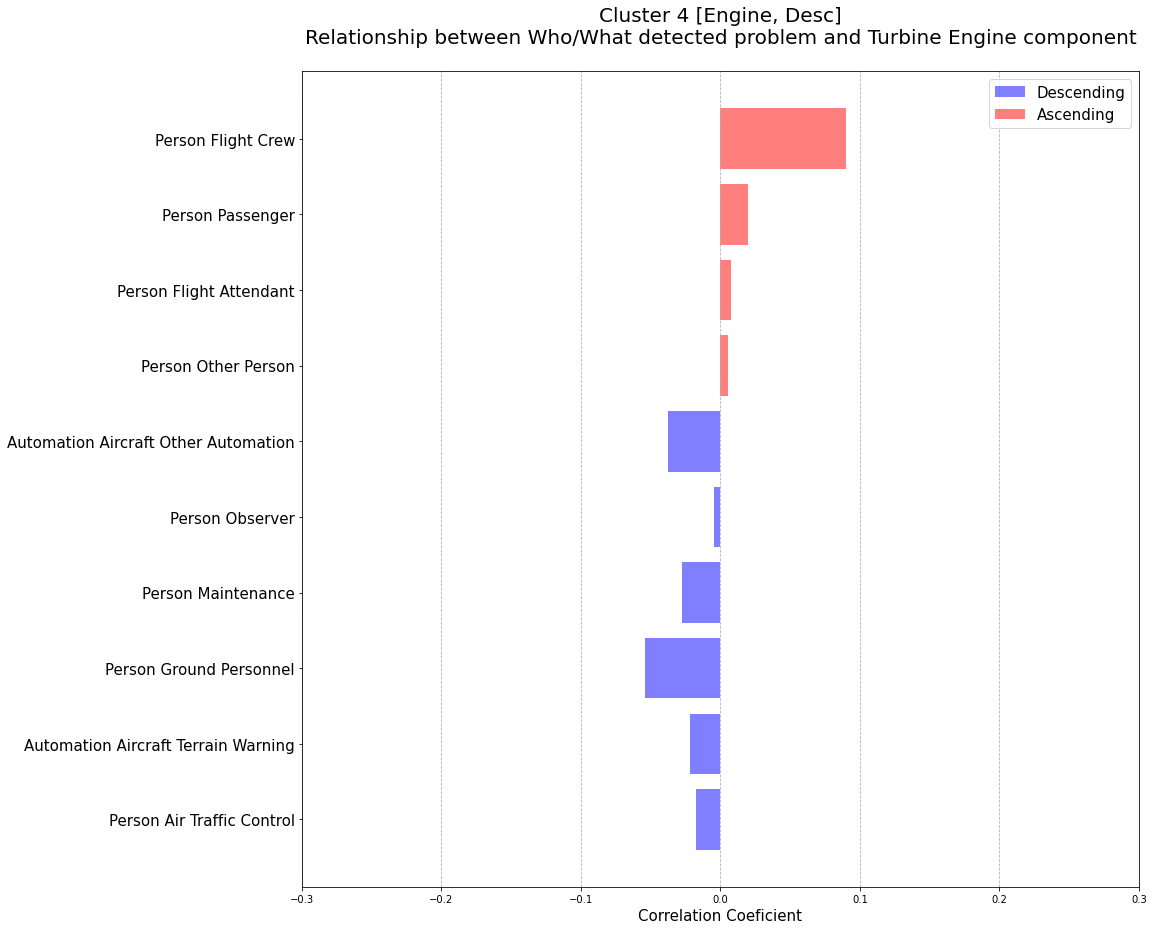
The Correlation Coefficient graph shows that although "Automation Aircraft Other Automation" is the second most identified detector, it has a negative (descendent) trend when the occurrence is related to Turbine Engine issues.
10. How effective are aircraft automation systems for turbine engine issues detection?
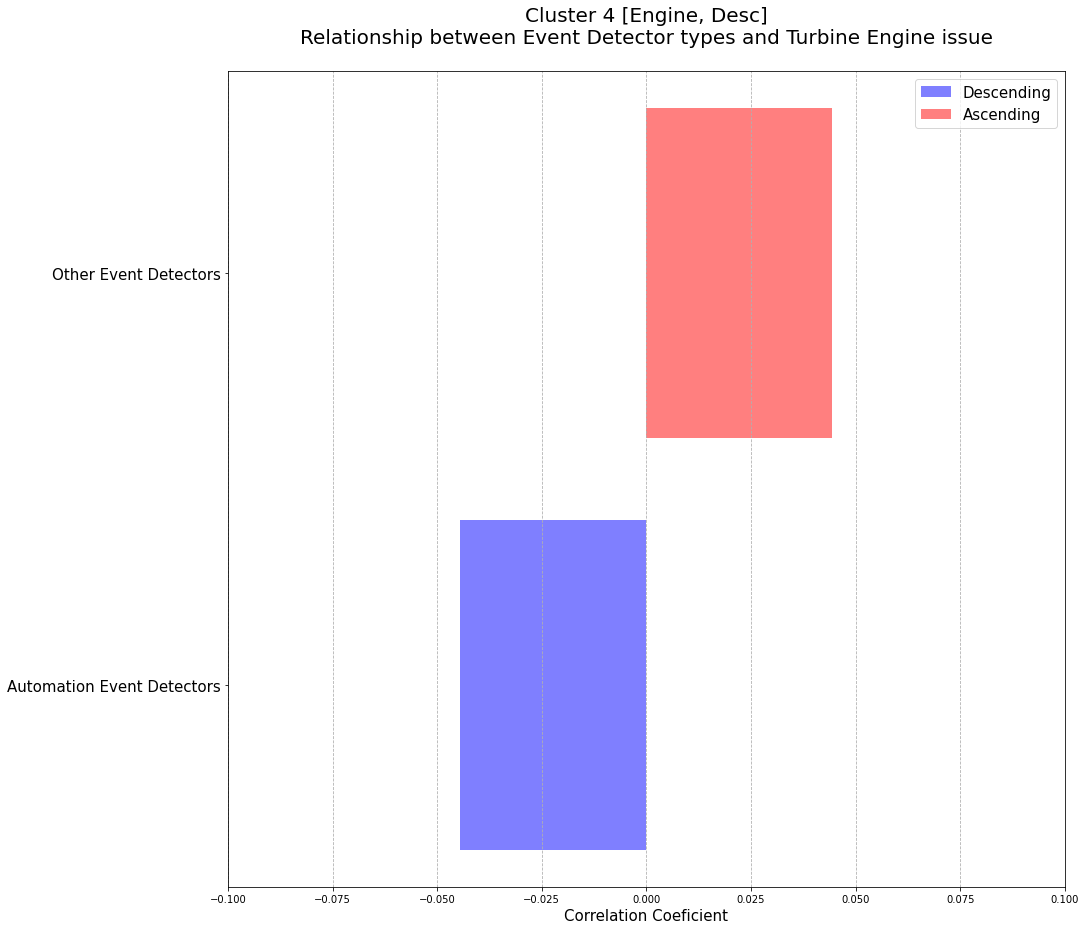
The Correlation Coefficient graph shows poorer efficiency of aircraft automation systems to detect Turbine Engine issues compared to all other event detector systems
CONCLUSION
This demo case study demonstrates how unsupervised machine learning, natural language processing, and correlation coefficient calculation can be used to discover hidden patterns from the aviation safety report database.
For simplicity, in this blog only the relationships between turbine engine issues and aircraft models, flight phases, equipment malfunctions, and aircraft automation system detectors are shown.
In a real investigation, first-level clusters are further divided into the sub-clusters, and a drill-down correlation analysis is performed for all critical paths identified.
Marino Tudor
Founder & CEOGaliot Aero Ltd
March, 2021